Progress Photos/Charts: 2014.10.10 – A lot of changes & Flirting with my next milestone!
Progress Photos: 2014.10.10

Where I started – Me on Jul 26, 2014
 Me at my computer on July 26, 2014 at my heaviest weight of 333 lbs.
Where I want to be when I reach my target fitness level:
 “Fit me” from back in the day! – All Cowboy’d Up!
This gives you a good idea of what I’ll look like when I’m fit and healthy.
‘course I have a few more wrinkles around the eyes now… LOL
This week on my “Journey to Health & Fitness“
 Well, friends and neighbors, there was a whole lotta changin’ goin’ on this past week:
First the numbers:
Total Body Weight is SLIGHTLY UP
Body Fat Percentage is DOWN
Total Inches are DOWN
Weight at Jenny Craig weigh-in is SLIGHTLY UP
Which means friends, neighbors, and the wayward Internet surfer who ended up on this page because he clicked on the wrong link… I gained lean body mas. Yeppers, you heard me. I gained lean body mass.
And… I think that the weirdness with the “Body Fat” BIA measurements that I talked about last week at great length may be settling itself out. Body fat is coming back down from it’s new high at about the same rate as what it was before the “weird jump up” and my “lean body mass” once again is increasing. Both good things.
The “weird jump up” in body fat caused me to start doing a LOT of reading about “body fat analysis” by “bio-electrical impedance” and my conclusion is that:
- for me it is still the best choice because of its convenience and low cost.
- to minimize the impact of its potential high error rate, I need to be hyper-viligant about measuring myself each day in exactly the same way and at the same point in the morning and evening routines.
Flirting with my next milestones…
 I will probably hit the next “weight” milestone before I hit the next “body fat” milestone. However, that being said…
My next weight milestone is 319.70lbs. On Friday, I was at 322.70. Yesterday, on Saturday, I was at 321.3 lbs! Woot! That 319.70 is definitely within sight!
The next Body Fat Milestone is 39.70% so there is a ways to go before I see that one. But I’m making progress… Woot!
And the next milestone means a new “Milestone Video”! Woot! In case you missed it, here is my FIRST Milestone video:
Changes to the Charts reflecting Changes in the Real World
I deleted the slide shows from the blog. The built-in slide show was presenting the charts in such a way that they were so small you couldn’t really see anything. Urk. I’ll bring back the slide shows once the migration of my blog from WordPress to BlueHost is completed and I have more control over the mechanics of the blog.
HOWEVER, another reason I deleted the slideshows because I made some BIG changes to the charts including fixing a formula error which was throwing off the body fat chart. So all the charts before the ones from 10-10-2014 look a bit different from the ones 10-10-2014 and after. Urk!
In a weird way I’m grateful for the body fat jump that occurred three weeks ago. If not for that, I would have never taken a hard look at the formulas and found the typo. Whew!
- First, I extended the amount of time that I anticipate it will take me to reach my “new improved” fitness and health level all the way out to July 2016. Yes, that is two years. The weight is coming off slower than I had originally anticipated. Rather than have me not meeting the “goals” on a regular basis, I lowered the threshold so that the actual and the goal lines on the charts are now closer to one another. This also stretched out the charts themselves so when I eventually fix the “slide show” sections and put them back up for folks to see there will be a big VISUAL JUMP between the way the charts look on Oct 10, 2014.
.. - I changed up the colors and lines a bit to make the charts more legible.
.. - I added a brand new chart: BMI — I hate BMI.. (more on that later) BUT since the Body Fat went wacko, I wanted another “check point” or measurement which would tell me whether or not I’m getting healthier and fitter. The idea here is that if the majority of the indicators are DOWN for the week, then things are groovy even if one or two indicators say that things are NOT groovy. Majority rules!
.. - I have been measuring myself weekly since I started my Journey to Health & Fitness, however I’ve only posted the chart for the Primary Inches which include hips, waist, & chest. This week however when I was measuring all the “additional bits” which include neck, biceps, thighs, and calves, I noticed that thighs had shrunk dramatically. Woot! Which made me curious. So I added a “sum” column to the part of the spreadsheet where I input those numbers and I saw that the “additional” bits were showing my health & fitness improvement as well as and sometimes more clearly than the “primary” bits.So… I made that extra column a permanent feature of my spreadsheet and then I added a “Grand Total” inches which combined the inches for the primary bits and the additional bits. And all three lines show a downward trend. Woot!
Keepin on Keepin on
The moral of this little expedition in to the intricacies of BIA and mathematical and statistical analysis is… [drum roll please]
- I am on the right track.
- The numbers are headed in the right direction.
- My little bit at a time approach is going to work.
- My “look at everything” “evaluate everything” “do nothing anymore just because I’ve always done it that way” approach is working.
Progress Charts
Body Composition Ratio: 2014.10.10
Total body mass is down. Yay! Lean body mass is up! Yay! I still think that the drop in LBM which is based on the increase in Body Fat is an artifact of using BIA. I’m still keeping an eye on it. To “manage” that built in BIA error factor, in addition to taking four BIA measurements daily and averaging them, then taking the lowest of the Weekly Median, Weekly Average, and actual on Fridays as my “official” weekly #, I am also paying much greater attention to when and how I take the BIA measurements. I’m working on a blog post about the details of that so stay tuned.

Primary Physical Measurements: 2014.10.10
I will probably just show you guys the “Total Inches” chart from now on, but this week, because it is the “week of change” I wanted to show you all three of my “Physical Measurement” charts:
Total Inches:
This chart shows the sub-total of the Primary Physical Measurements, the sub-total of the Optional/Additional Physical Measurements and then the Grand Total Inches which combines the two sub-totals. You can see that the trend is downward on all three lines:
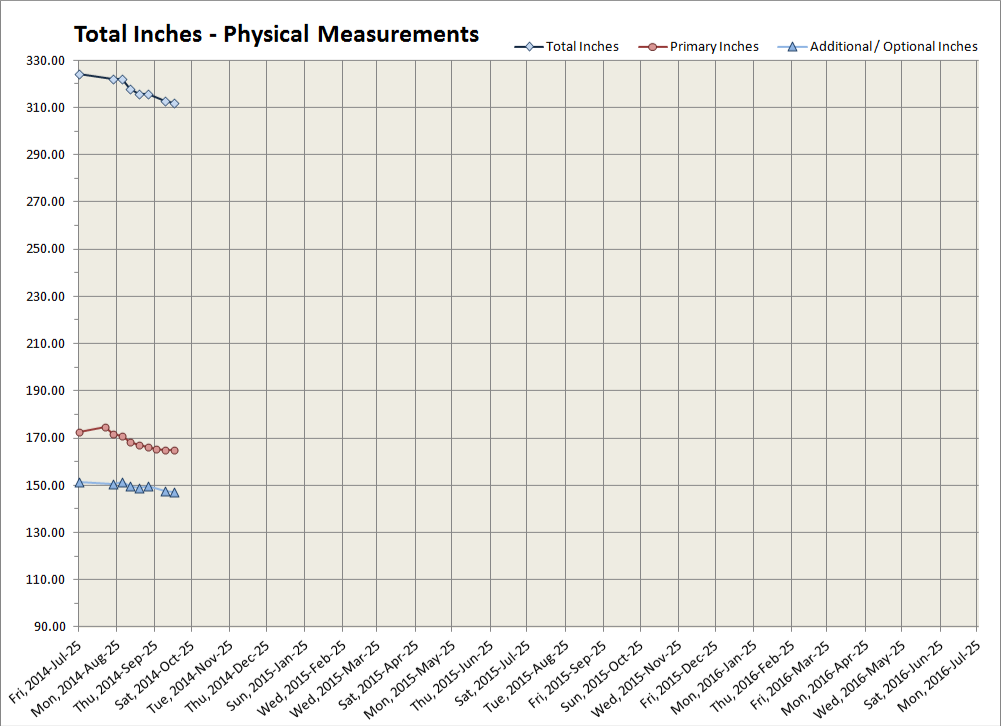
Primary Physical Measurements:
This is a “close up” of the three primary measurements that I take: chest, waist, and hips. These are the three inches that you hear about in weight loss ads when they say something like “I lost a bee-jillion inches by taking Dr. Shyster’s Miracle Weight Loss Elixir”.
You’ll see that the overall trend is down. Both chest and waist are down this week. Hips is slightly up, but within the margin of error for measuring. In other words it is tough to get the tape measure in exactly the same spot each week. So there is a “wiggle” (literally) factor.

Additional / Optional Physical Measurements
These are my neck, the biceps, the thighs, and the calves. What caused me to pay attention to them is mostly the thighs. Check out that downward drop. I guess all that climbing up and down the stairs to do laundry is paying off! I’m losing a lot of fat in my thighs and muscle strength is increasing there too! Yay!

.
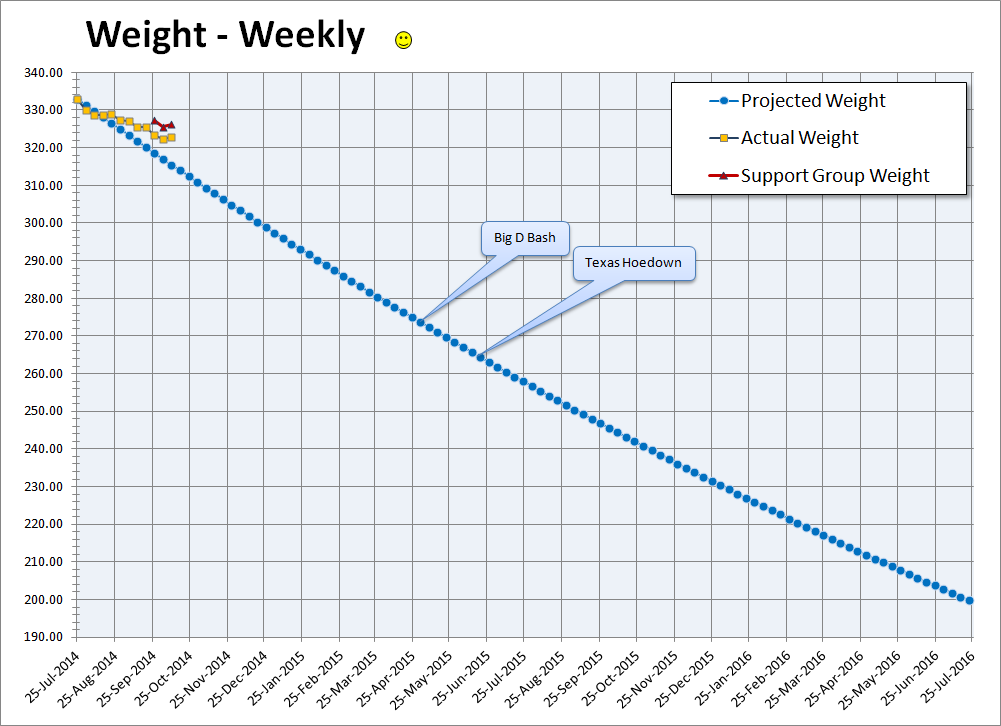
Weight: 2014.10.10
My total weight increased slightly this week, HOWEVER, I think that it is due to an increase in muscle mass. But I won’t know for certain until NEXT week. Because both the Body Fat percentage drop, the slight weight increase, and the slight lean body mass increase are ALL within the margin of error. So, if the number hold next week, then we’ll look back on this week and count it as a victory! Woot! But for now, I’ll count the overall picture as a success.
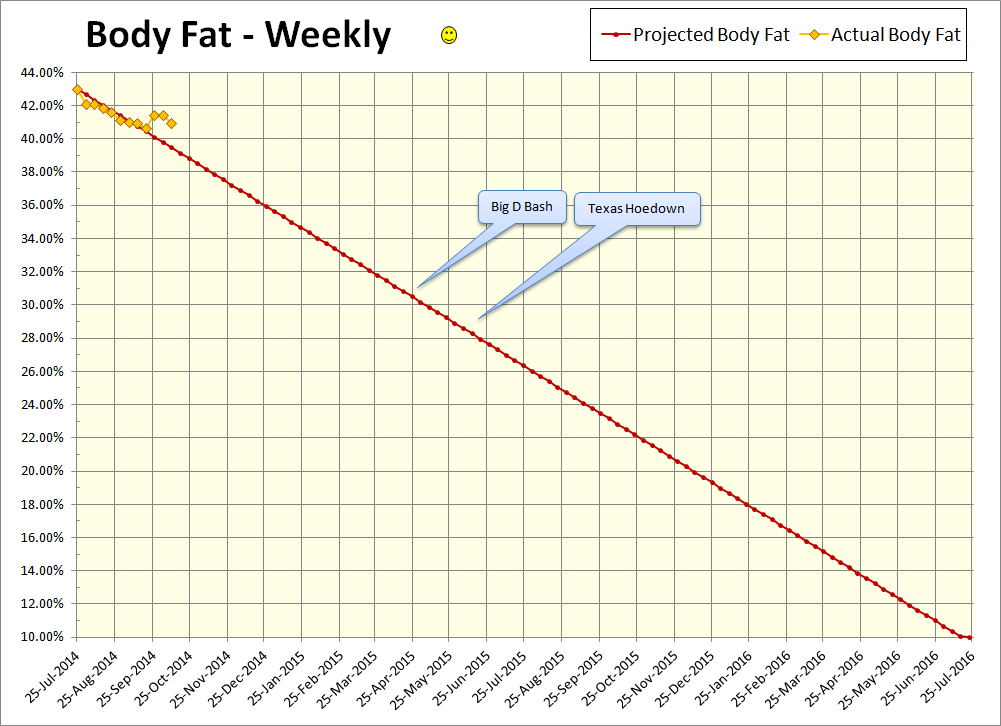
Body Fat Percentage: 2014.10.10
I’ve done what I can on the “measuring body fat” front. I’m being more diligent about how and when I measure myself using BIA. Since the very strange jump three weeks ago, the BF has been dropping about what I’d expect each week since then. But then I consider that the entire amount of body fat that I’ve lost to day is still within the horrible 8% possible range of error and… sigh…… So, I’ll be viligant, and diligant and I’ll not rely solely on this measure.
I’m trying to find a low cost facility to do a BodPod, DEXA, and Hydro measurement of my body fat so I have those numbers to compare to the BIA number. But money is a real issue. Anyone want to pay to get me tested?
..
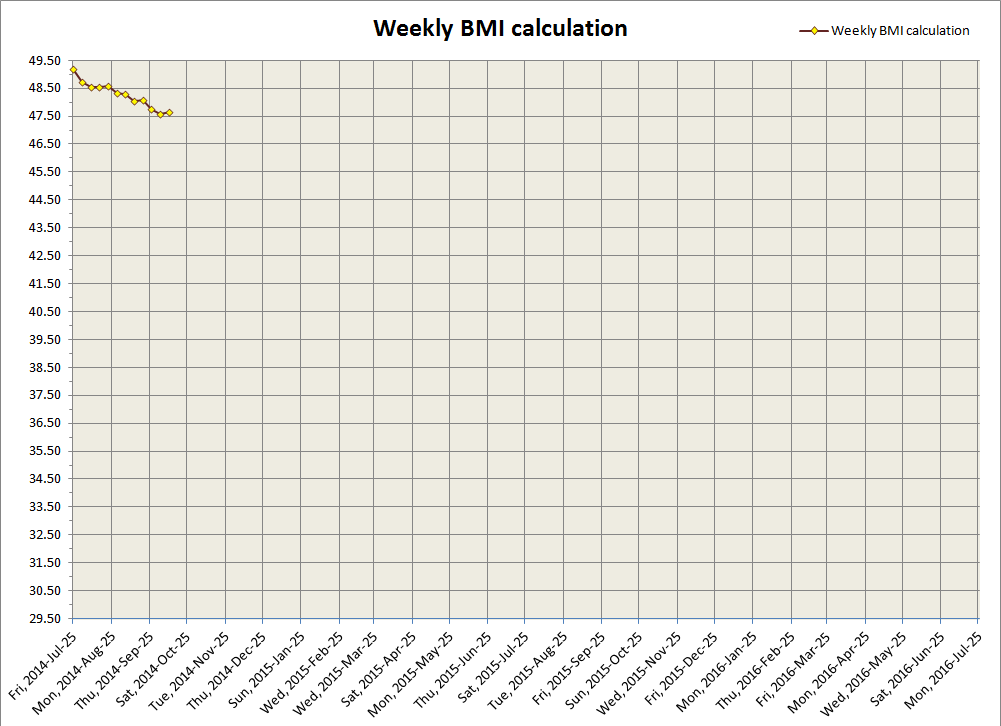
BMI: 2014.10.10
This will probably be the only time I ever show the BMI chart from my spreadsheet on this weekly report. I do not like BMI as a measurement. It is based solely on total body weight; study after study has shown that BMI is good as a measure for populations but it is terrible as a measurement of the health & fitness of an individual.
Nonetheless, it is one more data point where I can see a downward trend in the numbers. And if or when the BIA measurements go wacky again, I’ll be able to add this to the “Majority rules” pool of data.
See ya on the dance floor!

Share with folks on the Interwebz :-)

Posted on Sun, Oct 12, 2014, in Progress Photos and Charts and tagged after, bad, before, before after, before after photos, before and after photos, Body composition, Body Fat, braums, cats, Chest, cowboy, fat, fit, fit and healthy, funny cats, getting fit, getting healthy, good, good bad, Hips, inches, journey to health and fitness, LOL Cats, Lolcat, losing weight, progress, progress charts, Progress Photos, progress report, skinny, thin, total body mass, Waist, water, water weight, weekly progress report, Weight loss. Bookmark the permalink. Leave a comment.


Leave a comment
Comments 0